Yesterday, Italy reported 368 deaths from the Wuhan Corona virus pandemic. The day before, it was 250 deaths. The crisis of a generation is unfolding before our very eyes. The horror of exponential growth is beginning to sink in.
When you look at how the numbers exploded in China, Italy, France, the US and Iran, it is easy to get a sinking feeling that the world is coming to an end. However, in fighting this crisis, numbers and data will play almost as big a role as healthcare services. The cases are bound to go up every single day. But by how much and how fast? It is only these numbers that can tell us if we are winning.
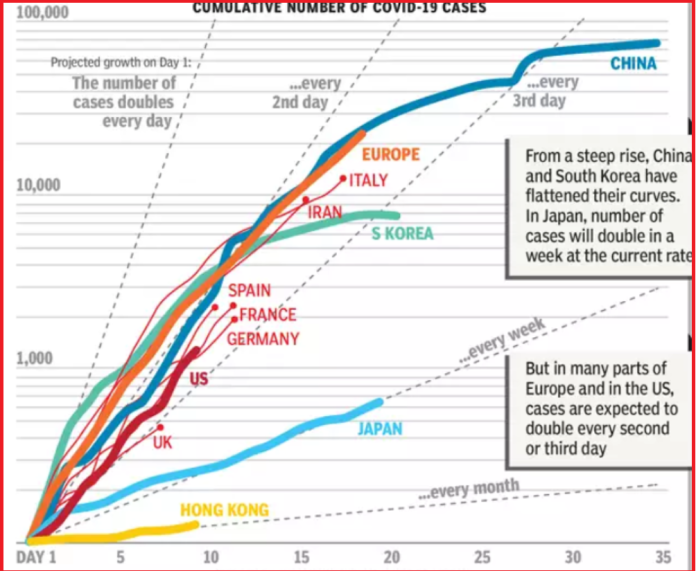
This very informative graphic from the Times of India tells us the story of how other countries have fared so far.

In China and Korea, the number of cases were initially growing at a terrifying rate of doubling every day. At this rate, it would have engulfed those countries in no time. Since then, with intensive lockdowns and social distancing, the curves have flattened out. European countries like Spain, France, Germany and Italy are stuck in the same zone, with cases doubling every 2-3 days.
So while it may appear that Italy is ‘worst affected,’ the truth is that France, Germany and Spain are doing just as badly. Italy just happens to be further along the curve than these countries are.
What really matters here is not the total number of cases, but the slope of this curve. You can see that Japan seems to have done a much better job, with cases doubling every week. In Hong Kong, they have performed very admirably, where it might take a whole month for the number of cases to double.
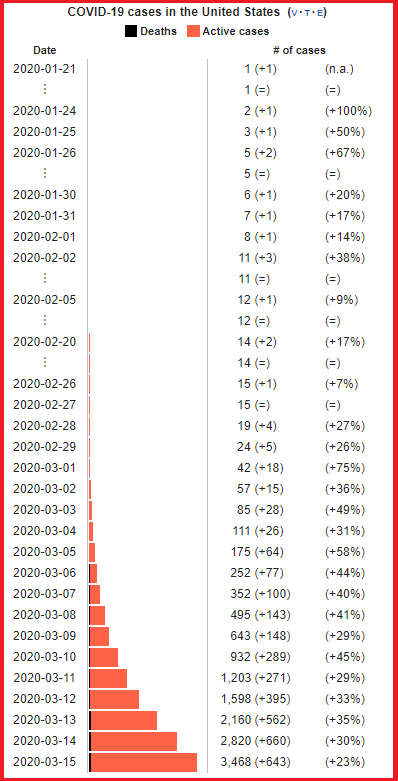
So where is India? By Sunday night we had 110 cases, up by 10% from 100 the night before. This Wikipedia graphic seems particularly helpful.

Every digit in this graphic matters. Say 111 cases may not feel like it is a lot more than 110 cases. But the fact is that 111 represents a growth of 11% over the previous day, whereas 110 represents growth of 10%. When dealing with exponential growth, every little bit counts. If the number of cases yesterday had been 115, that would have been 15% growth. Although that’s just 5 more than 110, think about, say, the difference between an interest rate of 10% and an interest rate of 15%. The cumulative effect is enormous.
The number of cases in India has roughly doubled in 1 week, which suggests we are closer to the path of Japan.
Let us consider the most terrifying question first. Is it going to get as bad as Italy or USA?

You can see that once the case number reached 80 or so, it began to explode. And since then, it has been growing daily at rates well over 20%. From 80, it jumped straight to 150 the next day and 227 the next.
In India’s case, we were at 77 on March 12. We were at 110 by the end of March 15. And you can see at a glance that our daily growth rates are well below 20%. That’s a huge difference.
The picture from the US is even more heartbreaking.

Though the US has a lot fewer cases than Italy, the situation of the former is actually much more grim. The daily growth rate is breaking 30% fairly regularly, with several above 40%! This looks like apocalypse. No doubt about it.
India went from 77 to 110 in 3 days. The US went from 85 to 252 in 3 days. Significant difference.
There are some obvious questions people might ask here about India. Are we testing enough people? Perhaps our case numbers are also growing at those terrifying rates and we just don’t know?
Well, not very likely for at least two reasons:
(1) When case numbers were around 80-100 in either US or Italy, those countries were pretty chilled out about the disaster, hardly testing anyone. They were caught napping. If anything, we are probably testing people much more than they were back when they were at our level.
(2) It makes very little sense to consider number of tests per unit of population. A virus does not spread evenly. It starts with incoming foreign travelers and radiates out of a center. As long as we can trace those rays efficiently and test the people who come in contact, we are doing fine. The rest of the population barely matters. The total international air traffic to India would be much less than the US. That’s what we need to look at.
Let us take one more look, this time at Brazil, a country where the number of cases has not piled into the thousands yet.

On March 11, India and Brazil had almost the same number of cases (~70). On March 14, Brazil reached 180 and India 100. See how quickly the gap has opened up.
It is of course way too early to celebrate. There is no room for complacency. But remember that an exponential curve is extremely unforgiving and differences in growth rates will show up very quickly. This is one instance in which early numbers can be taken quite seriously.
So there is grounds for cautious optimism. As of this moment. We do not know for sure what tomorrow will bring. Or even the next hour. Everything could fall apart any second.
The next seven days are crucial. And each one of us is a soldier in this fight.
Bear in mind that we do not even know what it means to “survive” the crisis. For now, we can close our borders, halt our economy. But the US and the continent of Europe are being ravaged by the virus right now with no end in sight. We cannot keep everything closed permanently. If 60-70% of the US or Europe get the virus, what do we do? Permanently shut off all contact with them? Nobody knows.
It is at times like these that you understand the full meaning of the ancient Chinese curse: “May you live in interesting times.“


